The news of discovering that Investools really wasn’t moving to Think or Swim last month really couldn’t have come at a worse time. The photo for today’s post is a pretty good representation of the frustration I feel every time I try to research alternatives.
 First, we’ve met a lot of other frustrated and angry marooned Investools subscribers. We feel your pain. Thanks for your emails and comments with suggestions. Keep the communications up and we’ll help each other out as a community. For updates from this blog, subscribe to the newsletter to receive copies of the posts automatically. We use a professional, secure server that allows you to unsubscribe easily, with the click of the link at the bottom of the newsletter, if you ever choose to do so.
Rule #1 Investing™ Toolbox vs Investools®
Last month’s investment meeting was depressing. Instead of a discussion on stocks to buy, we raged a little, searched for alternative services, and took a look at a possible Investools alternative.
The first site we found was ruleoneinvesting.com’s Toolbox. It’s a partial replacement for the Investools’ Corporate Snapshot. The downside is that the screener/search tools are extremely weak. The search is tailored to readers of Phil Town’s online education and Payback Time book. The similarities to the Corporate Snapshot are good ones including direct links to expert’s recommendations, intrinsic value calculator, and financial growth rates. Those of you who are more technical traders won’t like the heavy fundamental trader focused tools. Maybe there is some room to learn Think or Swim screeners paired with the RuleOneInvesting.com.
You may want to read this blog post by Phil Town for an explanation of Payback Time. It will help understand why his search tools and corporate summary are not setup the same way as Investools. https://www.ruleoneinvesting.com/blog/how-to-invest/phil-town-explains-payback-time-and-stockpiling/
Price
Please note that, we have no affiliation or advertising relationship with RuleOneInvesting. The RuleOneInvesting monthly subscription is currently $29.00 monthly (as of Nov 11, 2017). They advertise that if you open an equities or options* account at TradeStation and every time you trade, they will rebate 20% of what you pay in commissions – right up to the full cost of your Rule One purchase.** (https://www.tradestation.com/promo/ruleone/).
Review
Technical
Con: The first thing we noticed is that the site is created in Flash. Flash is a dying technology, is slow, and is prone to a lot of technical issues. Phil Town’s company will have to rebuild their site in the near future especially since Apple removed support for Flash from their iOS.
Con: Entering symbols into the watch list was buggy for us. We tested it on Chrome, IE, and Firefox. During some hours the wait icon would spin for minutes and never add anything to the watch list.
Con: The watch list had trouble finding some symbols. If you type in FB for Facebook, Inc., it doesn’t bring up Facebook in the immediate results. If you click the “Show more results for fb” link, it doesn’t find it most of the time either. Searching for “Facebook” consistently worked though.
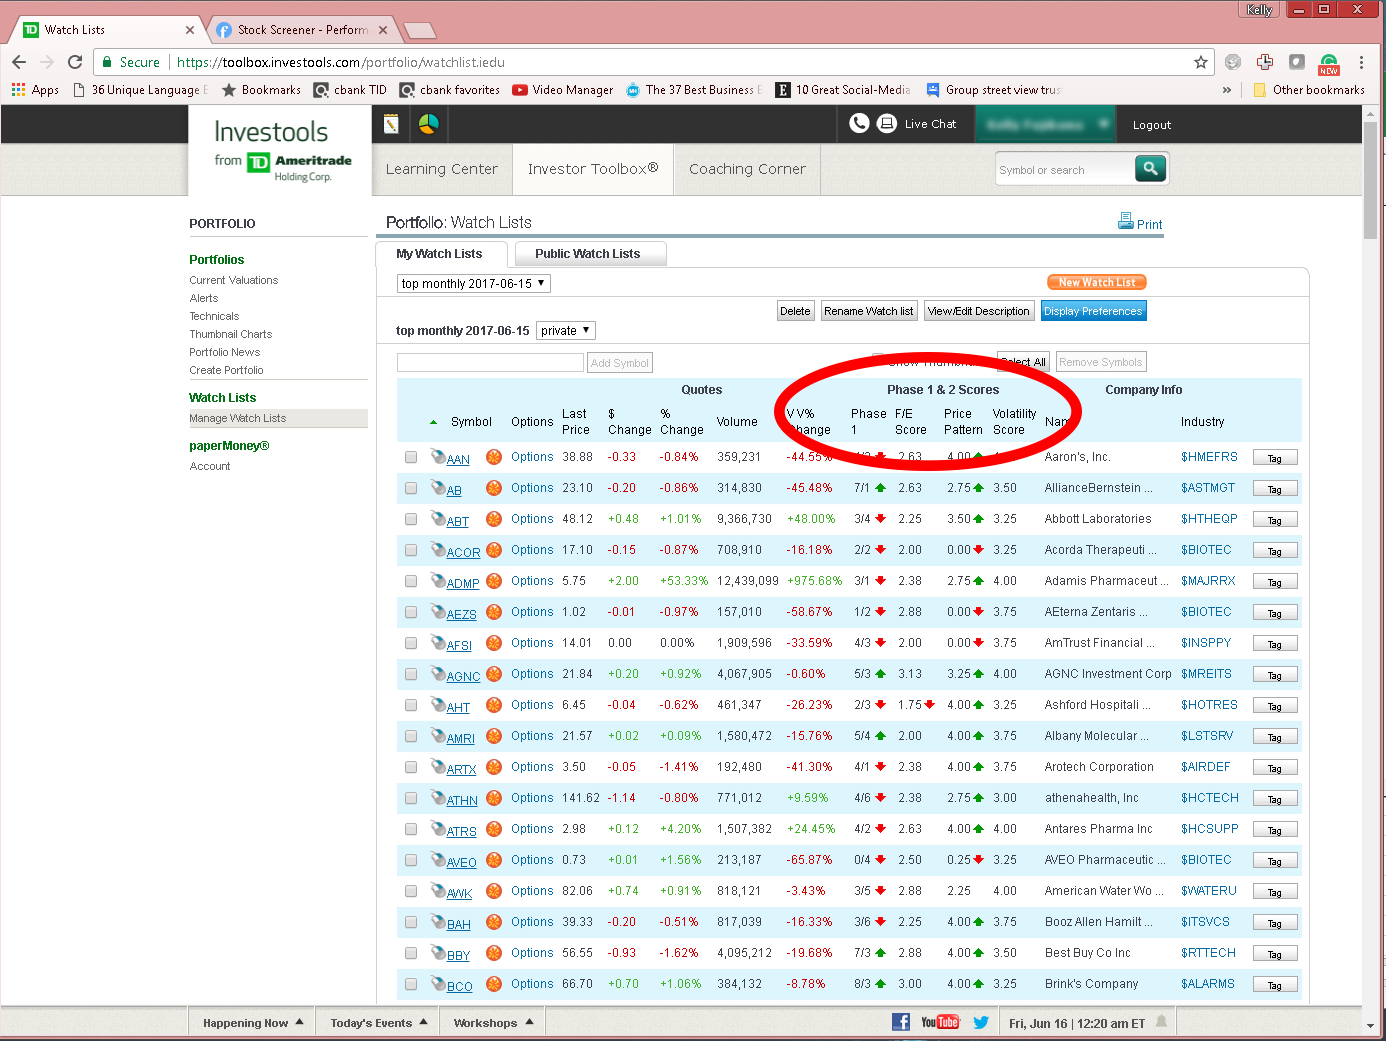
Con: You can’t import or paste a large number of symbols into the watch list. The site seems to be designed to pick companies in a one-by-one fashion to follow their Rule 1 system. That means enduring the above issues while trying to type in (one-by-one), up to, 50 stocks to watch.
Pro: Top notch technical support. Responsive and helpful human beings on the other side of the support email.
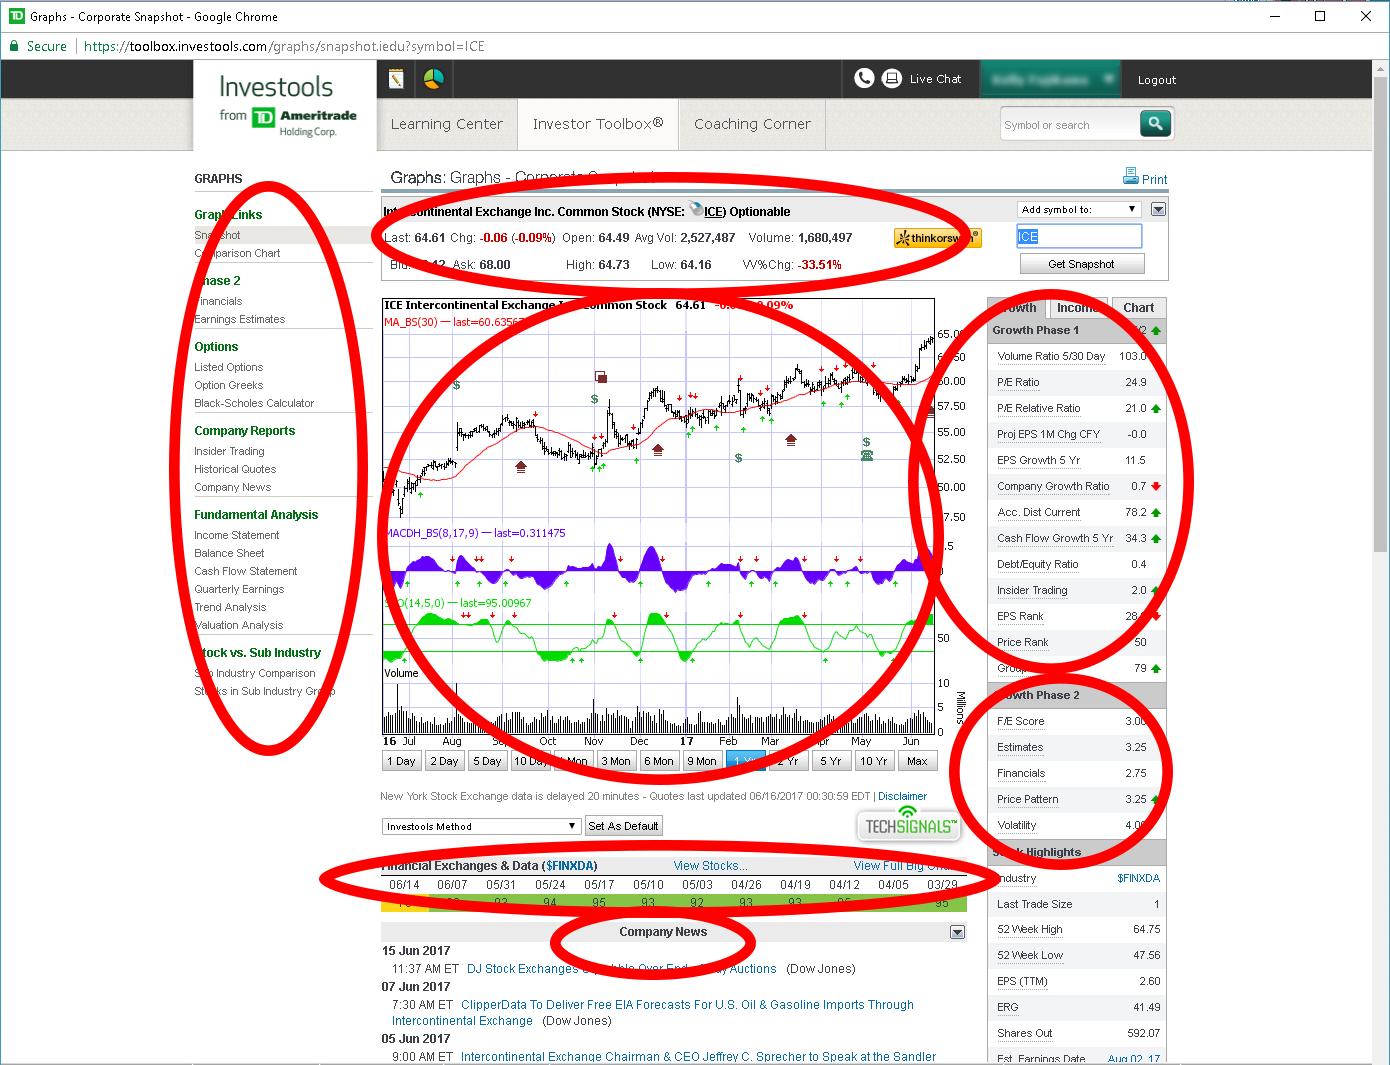
Corporate Snapshot
Con: Chart (Technical indicator Red and Green Arrows): There are some similarities between Investools’ “Corporate Snapshot” and Rule#1’s “Stock at a Glance”. The most glaring omission is the lack of a six-month chart showing the moving average (MA30), the stochastics (STO 14, 5, 0), and a MACD graph. This is odd because Phil Town’s Rule #1 book has at least one chapter dedicated to these technical indicators.
Con: Big Chart: There is no industry performance trend indicator. You can browse sectors and compare peer performance in the industries. It doesn’t provide the useful industry percentile performance information that the Investool’s Corporate Snapshop Big Charts did.
Pro and Con: Phase 1 and Phase 2 Red Green Arrows: There is no breakdown of the positive or trouble spots of a company in the familiar and useful red/green arrow chart. For example, there are no nice summary red/green ratings on sections like insider trading. The user can’t see, at a glance, that there is more money flowing out of the company by insiders than flowing in. However, the automatically calculated “4 M’s” and “Rule #1 Score” can loosely substitute for some of the Phase 1/2 indicators.
Pro: Company News: It is conveniently listed on the Rule #1’s “Stock at a Glance”.
Pro: Links to Analysis features: There are nice links for a value investor to jump straight to the company information most valuable to him or her to calculate an instrinsic value.
Feature Comparison Table
This table focuses on the features most used by our Investing Adventures club. Since we have a heavy value investor slant, we focused on the features we used at Investools the most. There are some other more technical trading features that many Investools subscribers used that are not listed here. Hopefully, we’ll find another service that makes up more of the gap. If you find such a service, please let us know and we’ll post a review.


There are signs investing-adventures.com has ceased to operate. e.g archives only go back to Nov. Is that true?
Otherwise I concur. After 6 months of using Investools Toolbox and thinkorswim platform, I had found a winning combination. I begged TDAmeritrade, with detailed reasons why, to bring Investools Toolbox, in its integrated entirety, to the new platform. They obviously weren’t trying to assist us in doing our own trading and the explanation I saw, that they wanted to sell us their support, seems to be the reason. Does anyone have a screener and the parameters to screen for stocks that have high phase 2 F/E scores?
Larry Z